
By Austin Walker · 3/25/2020

Below we’ll lay out exactly how we do it at datacenterHawk. At the end of this article, you’ll be able to take our approach and put it to use to help you succeed in your new role.
This is part eight of Data Center Fundamentals, datacenterHawk’s guide to getting up to speed on the data center market. If you’re a new participant in the industry, then this is for you. Instead of analyzing deep market trends, we’ll be covering the basics one step at a time. Be sure to subscribe to our monthly update to know when we release future topics.
If you would like to sign up for our free official Data Center Fundamentals email course, click here.
What Market Research Can Do For You
For some, market research might be a bit of an ill defined, fuzzy term. Put simply, market research helps people understand how a certain product or industry is performing.
Market research can help answer questions like:
- How much are people selling?
- How much are people buying?
- What price are they paying?
- What trends should I care about to help me make better decisions?
- Where should I take my business next to give me the best chance of success?
As the size and risk of your decision increases so does the amount of due diligence you’re likely to give to making a good decision. You spend a lot less time weighing the outcomes of putting together a $10 lemonade stand than you do when buying a $200,000 house. Even more so when you’re building a $30M data center or a $400M campus.
This is where market research can really be helpful - when you’re about to make a large outlay of cash that can be hard to take back. In the data center industry, it helps different people in different ways.
- As a data center provider or operator, you can figure out where to build your next facility by looking at which regions that have a lot of demand but not much supply. You can also see which regions are under supplied compared to their historical average.
- As an investor placing capital into an investment decision or asset, you can make an educated guess as to if the market is going to grow faster, slower, or not at all.
- As a consultant or broker, you can know when to press your leverage in negotiations for your client based on your knowledge of how hot or cold the market might be.
- As a vendor, you can forecast future revenues based on assumptions you can make on the growth of the industry globally, nationally, and regionally.
Of course, we think Hawk Insight is great for guiding these types of decisions. But regardless of where you get your market research, once you're making big enough bets, it’s generally wise to get a third party view of what’s going on.
It’s All About Supply & Demand
Let’s go back to our lemonade stand example.
If you’re the only stand on your block, chances are fair that a car would stop and buy your lemonade. But if 10 other kids on your block also set up lemonade stands, your chances drop precipitously. This is the concept of market supply. The more lemonade that people are offering to sell, the more supply is on the market.
Let’s say you relocate your lemonade stand. You’ll probably do better setting up on a busy neighborhood street or walking path instead of a sleepy cul-de-sac. Especially if you set up on a day where people are likely to buy lemonade, like on the first warm Saturday of summer. This is the concept of market demand. The more people there are and the more they’re willing to pay, the higher the demand is in the market.
Now if you’re an enterprising young girl or boy, you might realize you’d do even better setting up where there are lots of people, who really want lemonade, when there’s no one else around to sell it.
This is how people use market data to guide their decisions. By understanding the supply and demand of a market they can make a more informed decision on where the market will go and where they want to be.
Measuring Data Center Market Supply
Lets map this to the data center industry.
On the supply side of the market, the lemonade stands are data centers. The family that runs one or more lemonade stands are data center providers or operators. Instead of selling lemonade, data center providers sell capacity. Instead of measuring in cups, the primary measure of capacity is electricity consumption, specifically kilowatts (kW) and megawatts (MW).
Capacity is a tricky thing to understand for people new to the industry. In commercial real estate, the main driver of the price of a lease is the square footage. It’s fairly straight forward: the more space you lease or build, the more it’s going to cost.
With data centers though, you can stack lots of servers vertically into the same 2'x3' footprint. Depending on how well the data center can cool the servers, the more servers they can stack more closely together and the more use they can get out of their square footage. This is the concept of density.
To tie it back together, let’s say we have two data centers: DC#1 and DC#2. Each facility has the same square footage. DC#1 though has invested heavily in cooling technology and can fit twice as many servers in their facility compared to DC#2. A server is going to draw the same amount of power regardless of which facility it’s in. So it makes more sense to measure things based on the electricity it consumes rather than the square footage it occupies. As such, DC#1 will probably be seeing double the revenue of DC#2.
This is why capacity is primarily measured in electricity consumption, not square footage. It provides a better apples to apples comparison across data centers. It also lets data centers invest in better cooling technology and suddenly have more “lemonade” even though they didn’t expand the building.
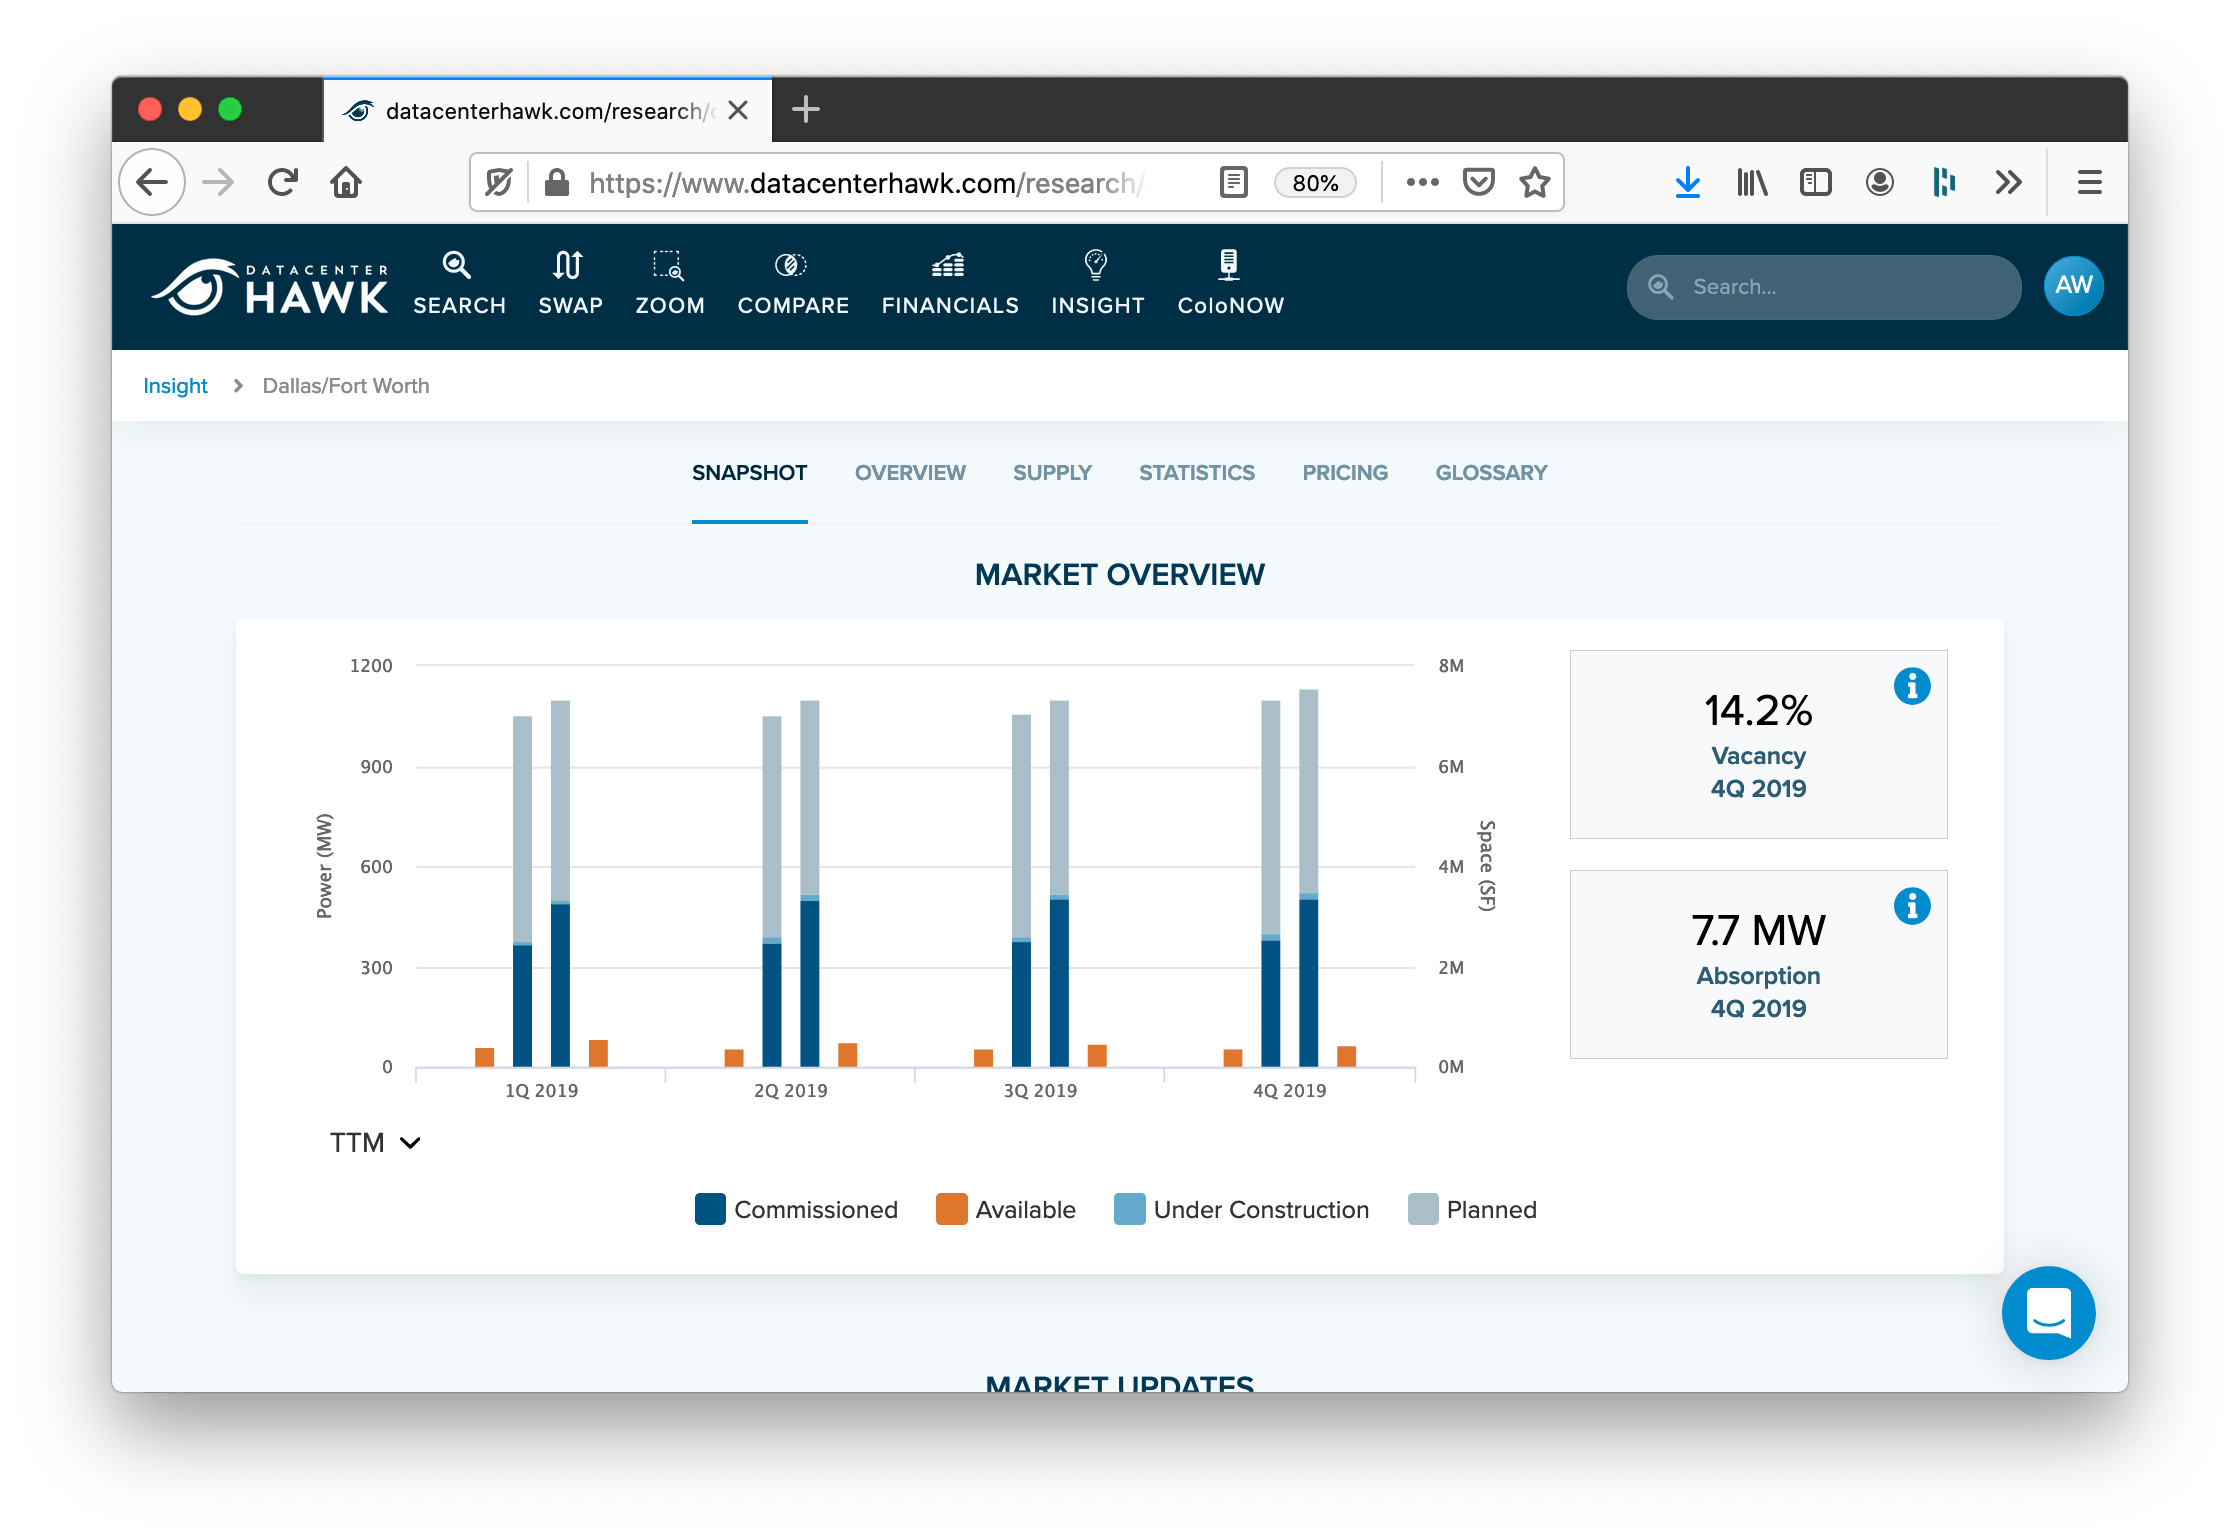
To determine the market size, you basically add up all the capacity at all the data centers that is currently leased or is available to be leased. This is what’s called commissioned power. If you want to size a specific market like Northern Virginia or London, you just add up the commissioned power of the data centers in those markets.

By our math at the end of 4Q 2019, Northern Virginia had 1,209.43 MW commissioned power.
Smaller markets like Portland and Quincy come in at 57.81 MW and 73.53 MW respectively.
Measuring Data Center Market Demand
Let’s go back to the lemonade example and talk about the demand side of the market. Instead of people driving by in the cars, data center customers are called tenants or users. These tenants might be one person who’s mining bitcoin or it might be Facebook, Amazon, or Netflix supporting an entire region of the US. Just like on the supply side, tenants are purchasing capacity that’s primarily measured by electricity consumption in kilowatts (kW) or megawatts (MW).
To measure demand, we want to know how much capacity was leased up by customers over a specific period of time. At datacenterHawk we calculate this quarterly. The resulting number is what’s called absorption.
Let’s say DC#1 has 10 MW commissioned. 9 MW are currently leased and 1 MW is available. Over the course of a quarter DC#1 leases up that last MW to a few tenants. Their absorption for the quarter would be 1 MW. It can get a little more complicated but that’s the basic concept.
Similar to sizing the market on the supply side, to size the demand side of the market you simply add up all the absorption from all the facilities in the market for the period.

By our math in 4Q 2019, Northern Virginia absorbed 19.19 MW while Portland did 2.25 MW.
Gathering, Standardizing, and Verifying the Data
So where can you get all this data to analyze?
We think Hawk Insight is great because you can jump to the analysis in just a few clicks. But you can actually gather the data yourself from lots of places. It just takes some legwork to gather it, interpret it, and standardize it before you begin to analyze it.
See how you can skip everything in this blog and get straight to what you need with Hawk Insight.
Gathering Data
You can find data from lots of different sources.
Start with information from data center provider websites. They’ll typically list the facilities they operate, where they are, their capacity, and other infrastructure details. Brokerage reports from companies like CBRE or Cushman Wakefield are also great sources of market data.
There are also market research firms dedicated to providing data and analysis. Many firms offer purchasable reports that they produce on a yearly cadence. Other companies have built online platforms that are easy to use and are constantly updated with real time data. This is what we’re continuing to build at datacenterHawk.
There’s nothing wrong with using good old Google to find out what’s going on. Frequently there will be press releases or announcements whenever a provider is expanding a facility or campus. You can also find announcements across social media.
Standardizing the Data
As you research capacity data, you’ll want to be pressure testing each data point as it comes in.
For example, it’s fairly easy to find press releases about a provider adding a MW to a specific data center. But having 1 MW commissioned or available right now is very different than it being under construction or even just planned. Frequently this portion of the announcement is left off and you need to do some additional digging to figure out what they’re really saying.
We recommend you only count commissioned and available power for the most accurate view of the market like we do at datacenterHawk.
Verifying the Data
As you piece together your market data, you’ll also want to pressure test how reliable the data is.
Some firms will extrapolate their numbers with a top down approach. This means they gather a few sample data points and assume the rest of the market shapes up along the same lines as their sample data. This is great for getting a quick read on the market but isn’t as bullet proof as a bottoms up approach.
With a bottoms up approach you go facility by facility in every market and roll up those capacity figures to the national level. This takes a lot more time than going top down but it’s much more reliable.
At datacenterHawk we take the bottoms up approach to building our market calculations and we do it that way each and every quarter.
Just Talk to People
Some data just isn’t on the internet. It takes going to conferences, traveling to see people, and helping everyone you talk to along the way. The great part about this is you get to build deep relationships with the people in the space. We’ve even had lots of them on our podcast to talk about what’s transpiring in the industry.
If you’re new, we’d love to talk to you too and see what we can do to point you in the right direction. You can also subscribe to our monthly update to get more great content like this along with hard data on the market.
Talk to you soon!
This was part eight of Data Center Fundamentals, datacenterHawk’s guide to getting up to speed on the data center market. Be sure to subscribe to our monthly update to know when we release future topics.
