
By Austin Walker · 6/23/2021
What is Hawk Insight?
Hawk Insight is where our clients can access our interactive data center market reports. The reports cover 30+ data center markets including major ones like Northern Virginia and London along with minor ones like Denver and Milan. Each report comes with aggregate, up-to-date, data center real estate data like market growth, market demand, pricing, and vacancy rate, along with an analysis on the notable activity of the quarter.
What’s new in Hawk Insight?
We’ve released several updates to Hawk Insight to help you make better decisions about data centers. Tactically, these updates can help you:
- Better understand how today’s data forecasts future growth
- Get more insight into specific data center markets
- See more clearly the historical data for a market
Better understand how today’s data forecasts future growth
Opinions on future market growth can be easy to come by. At the same time, forecasts built on low-quality data sets are only as good as their underlying data.
With this latest release of Hawk Insight, we’ve taken the aggregated facility by facility data we’ve released every quarter since 2015 and added data-backed forecasting to Hawk Insight.

Our new forecasting view in Hawk Insight
For most markets, you’ll now see a four-quarter forecast of commissioned power that you can use in presentations, reports, or to bring some additional confidence to your strategic data center decisions.
Get more insight into specific data center markets
When you first access a data center market report in Hawk Insight, you used to be presented with a single large graph. This is great for an initial glance, but made everything but the most obvious changes hard to track.
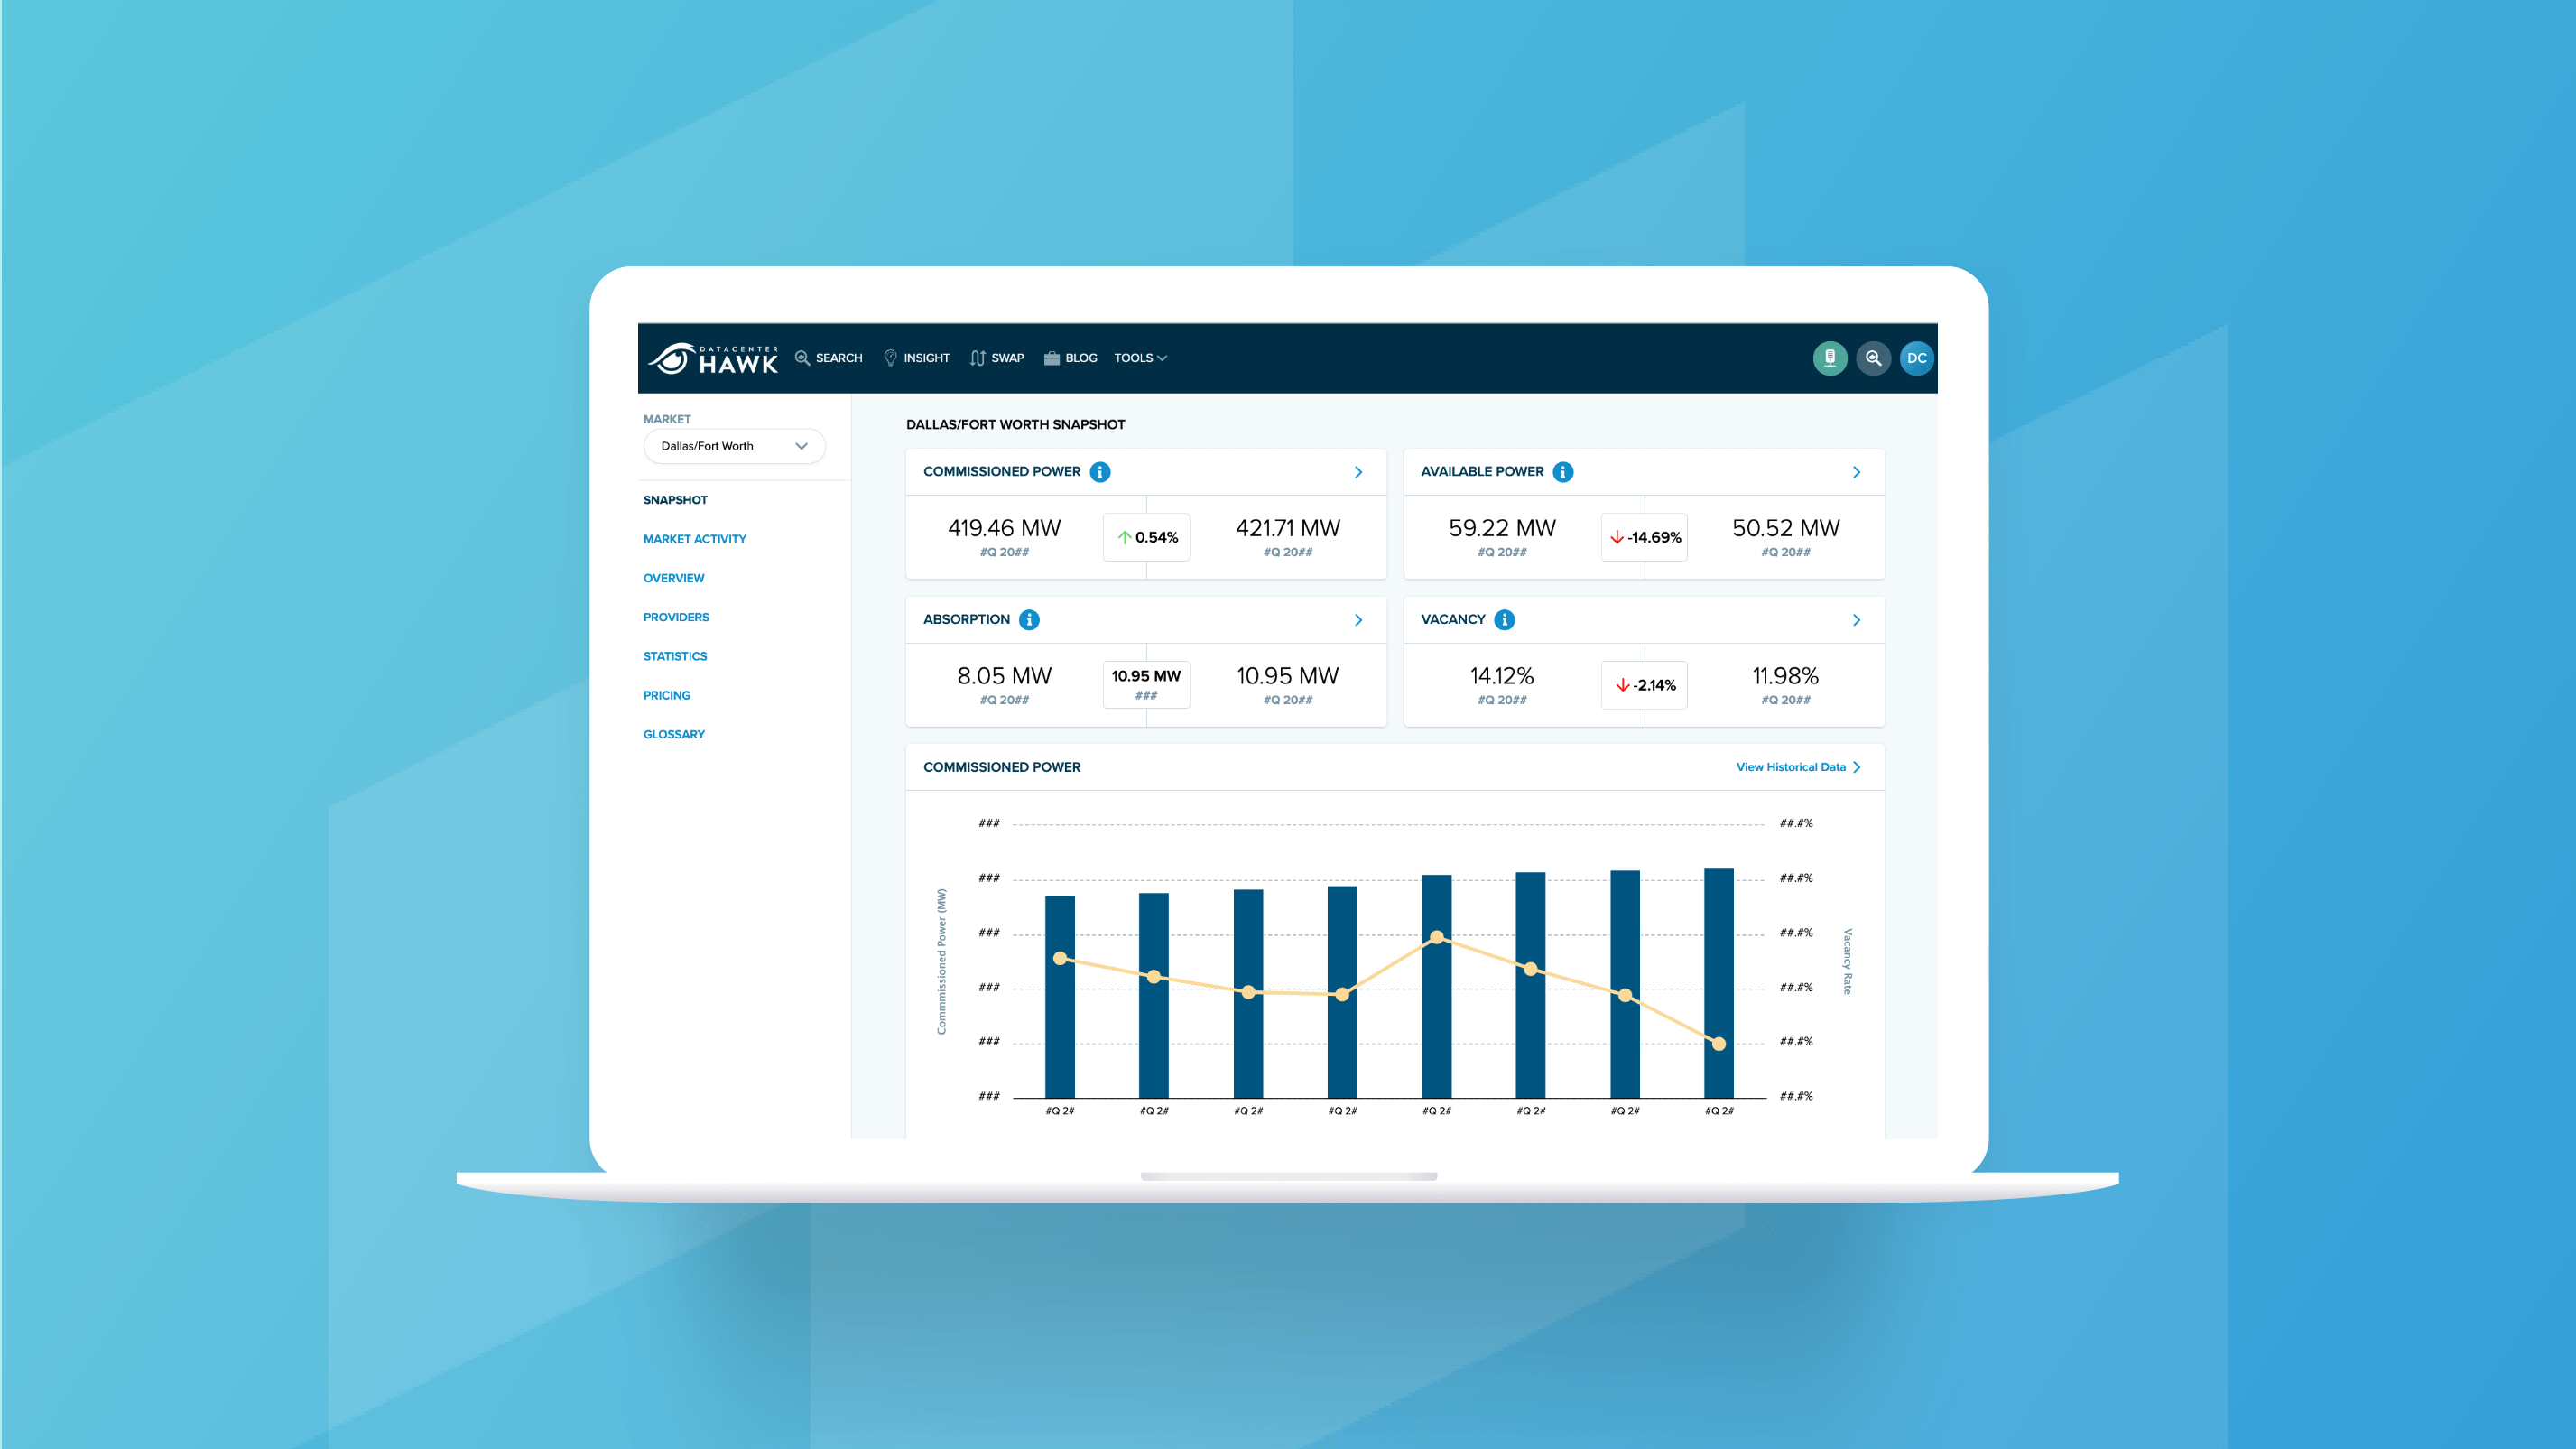
To help with this, we’ve pulled key data points like commissioned power, commissioned space, vacancy rate, and absorption out of the graph and presented the figures raw. We’ve also added how those data points changed compared to last quarter to help you see where things moved.

The new snapshot view in Hawk Insight
You can still access our more forward-looking data points like power under construction or planned power under the Statistics item on the left-hand side of the screen.
See more clearly the historical data for a market
For those of you who are looking to pull data from the past, we’ve made it easier for you to get the details on what happened as far back as we have data.
Similar to our update above, we used to bake this data into a graph. This made it easy to make quicker judgments when there were larger changes, but wasn’t as easy when you needed to get into the minutiae of the data points or if the data points themselves were on a small scale.

The new historical view in Hawk Insight
Most data points we track in Hawk Insight now comes with a more robust historical reporting view, where you can still see the overall trend in a graph format, but you can also see the specific values each quarter in a table format. This way you don’t have to hover over the chart for every value you want to see.
You can also see how that data point changed quarter over quarter. If you’re looking to compare between markets, we’ve also included a comparison module that lets you see how this specific data point for this market lines up against other markets.
What hasn’t changed with Hawk Insight?
With these platform updates, it’s good to remember what hasn’t changed: our people, our process, and our focus on your performance.
We remain the same committed team to gathering, standardizing, and providing you with trustworthy data and analysis that helps drive better decisions and better performance for you and your team.
You’ll still be able to stay up to date on the latest market dynamics, be knowledgeable about noteworthy activity, and have data to back up your decisions.
The data we track isn’t changing. We’ll continue to report on:
• Commissioned power and space (i.e. market supply)
• Available power and space
• Under construction power and space
• Planned power and space
• Vacancy rates
• Absorption (i.e. demand)
• Hyperscale colocation lease pricing
• Wholesale colocation lease pricing
• Retail colocation lease pricing
At the market level, we’ll also continue to analyze the same aspects we did prior:
• Trends and updates
• Notable activity
• Utility power
• Tax incentives
• Hazard risk
• Connectivity
How do I access the new Hawk Insight?
If you’re a client and already have access to at least one market, all you have to do is log in here.
If you’re not currently a client, let’s set up a time to chat so we can help get you what you need.
